Project · 2026
Metal Plate Defect Inspection
Deep learning pipeline that replaces manual inspection with 95.5% accuracy
Overview
During a project internship with MathWorks, I led development of a metal plate inspection system in MATLAB with teammates Diego Hidalgo and Enoch Ho. It sorts plates from the MPDD dataset into four categories (good, scratches, major rust, and total rust) and turns that label into a final pass/fail decision, replacing manual inspection.
Every photo takes two paths. Image processing shows where a defect might be, and a trained ResNet-18 decides what it is.
Preprocessing
Turn a raw photo into a readable map of possible defects.
01Clean up the image
Each photo is standardized to 512 × 512 pixels, the plate is separated from the background, and uneven lighting is flattened with imflatfield so shadows and bright spots don’t read as defects.
Two copies move forward: a color copy for finding rust, and a grayscale copy with boosted contrast so scratches and texture stand out.
Flattening the lighting left a glowing halo around each plate’s edges. Instead of fighting the halo, the detectors ignore the background and outer edges and only look inside the plate.
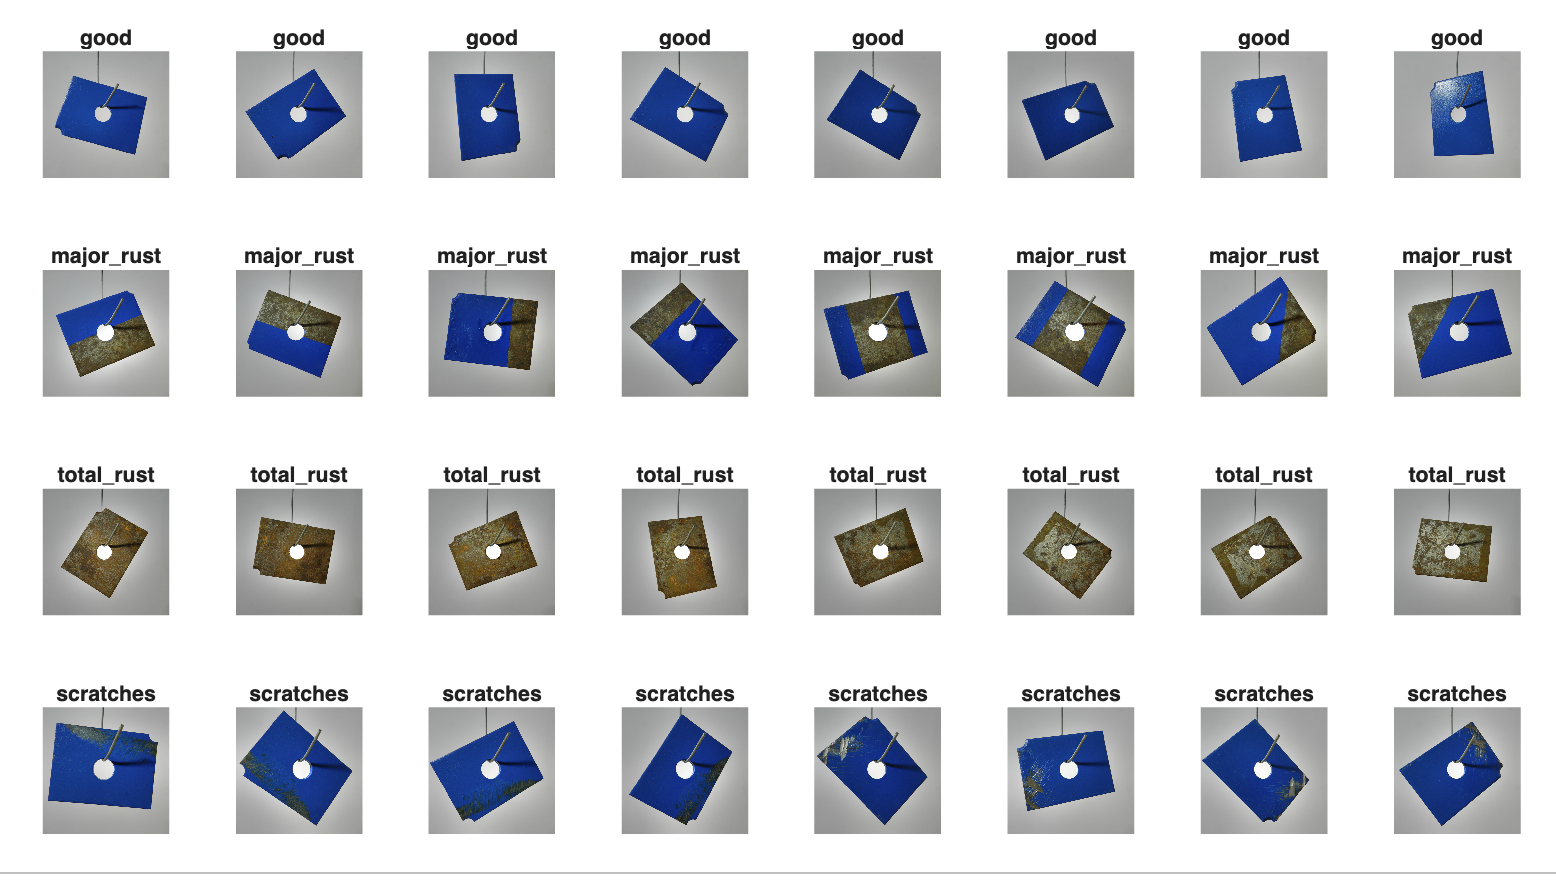 (opens full size in a new tab)
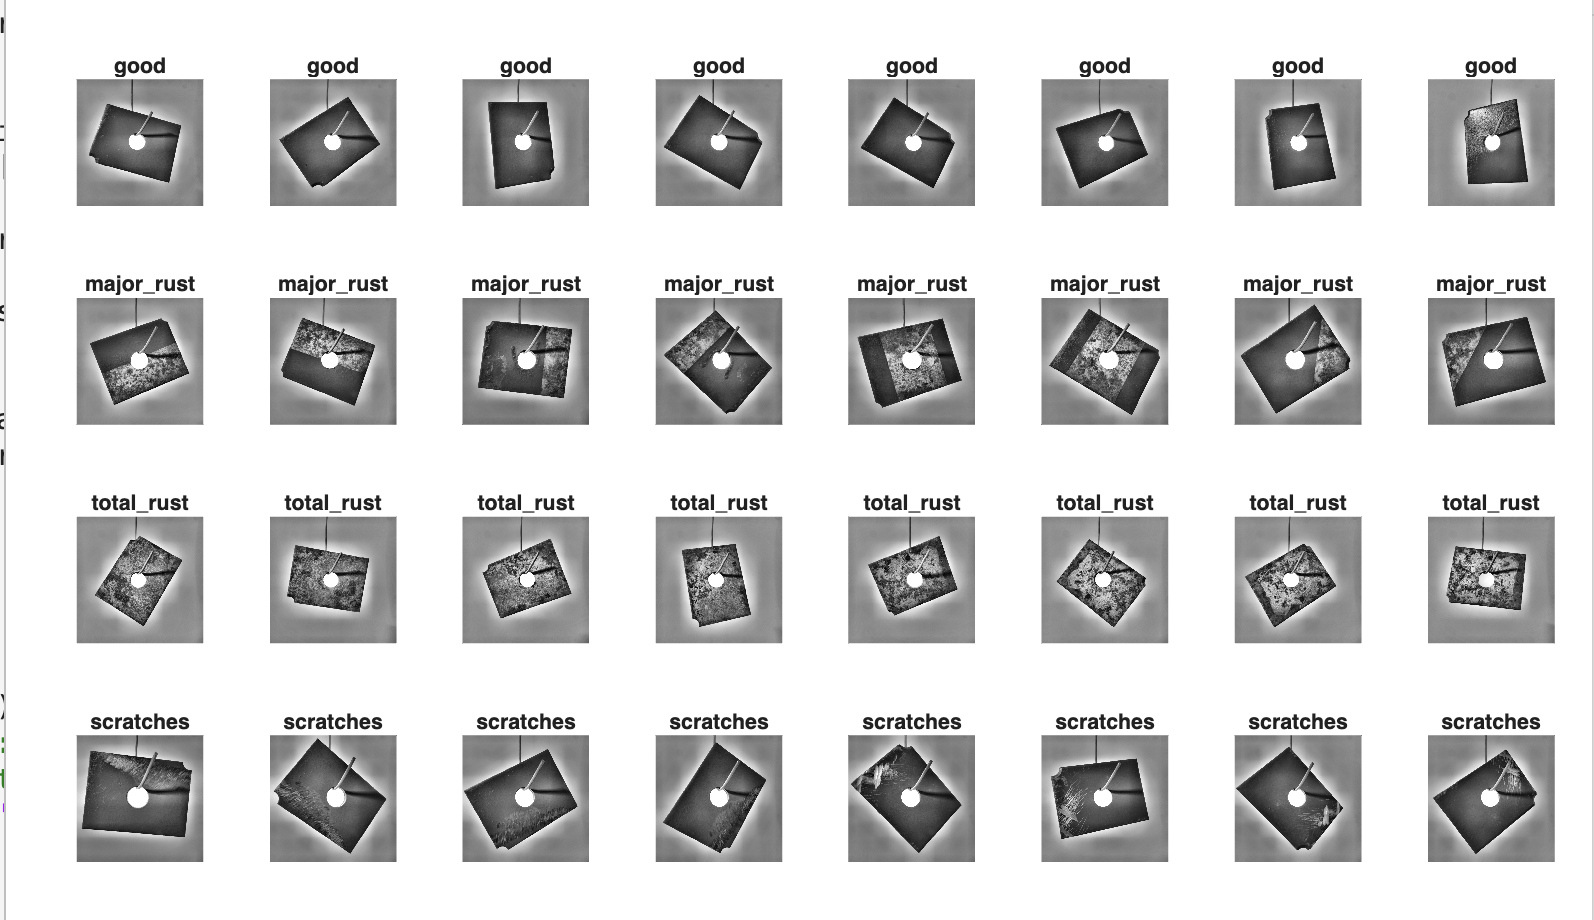 (opens full size in a new tab)
02Find defect evidence
Rust and scratches look different, so each gets its own detector:
- Rust, by color. The image is converted to HSV, and hue and saturation thresholds, tuned by trial and error, pick out rust.
- Scratches, by shape. The grayscale copy goes through edge detection to find scratch lines.
defectEvidence returns a rust mask, a scratch mask, and a combined evidence mask for the plate.
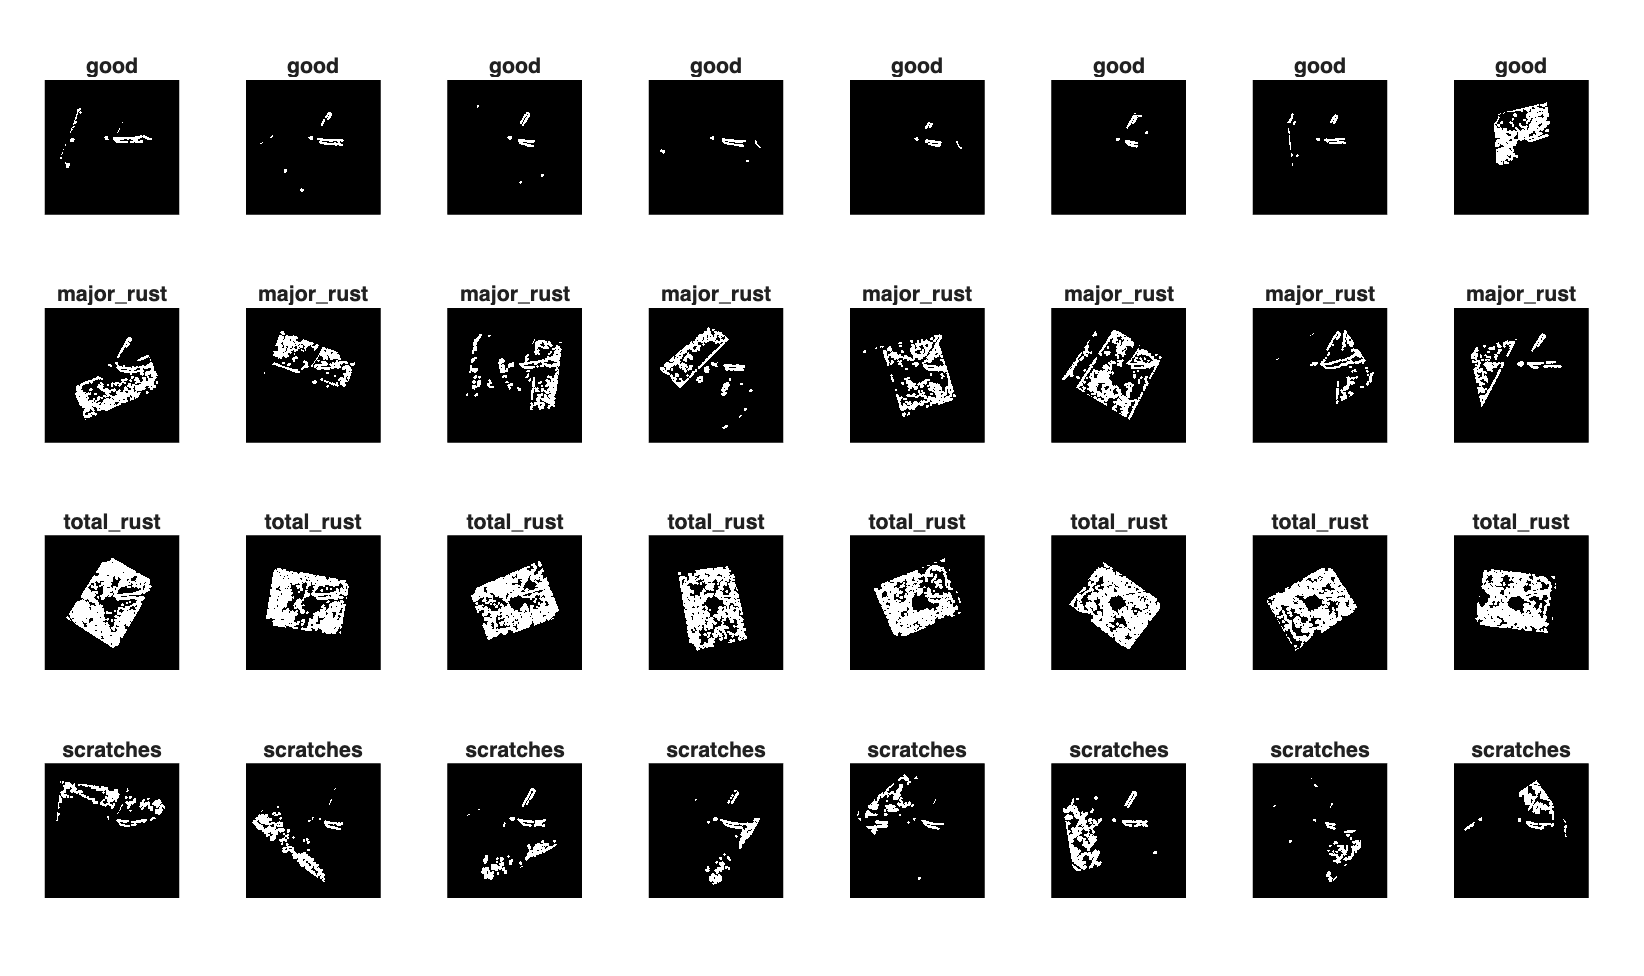 (opens full size in a new tab)
03Overlay and baseline decision
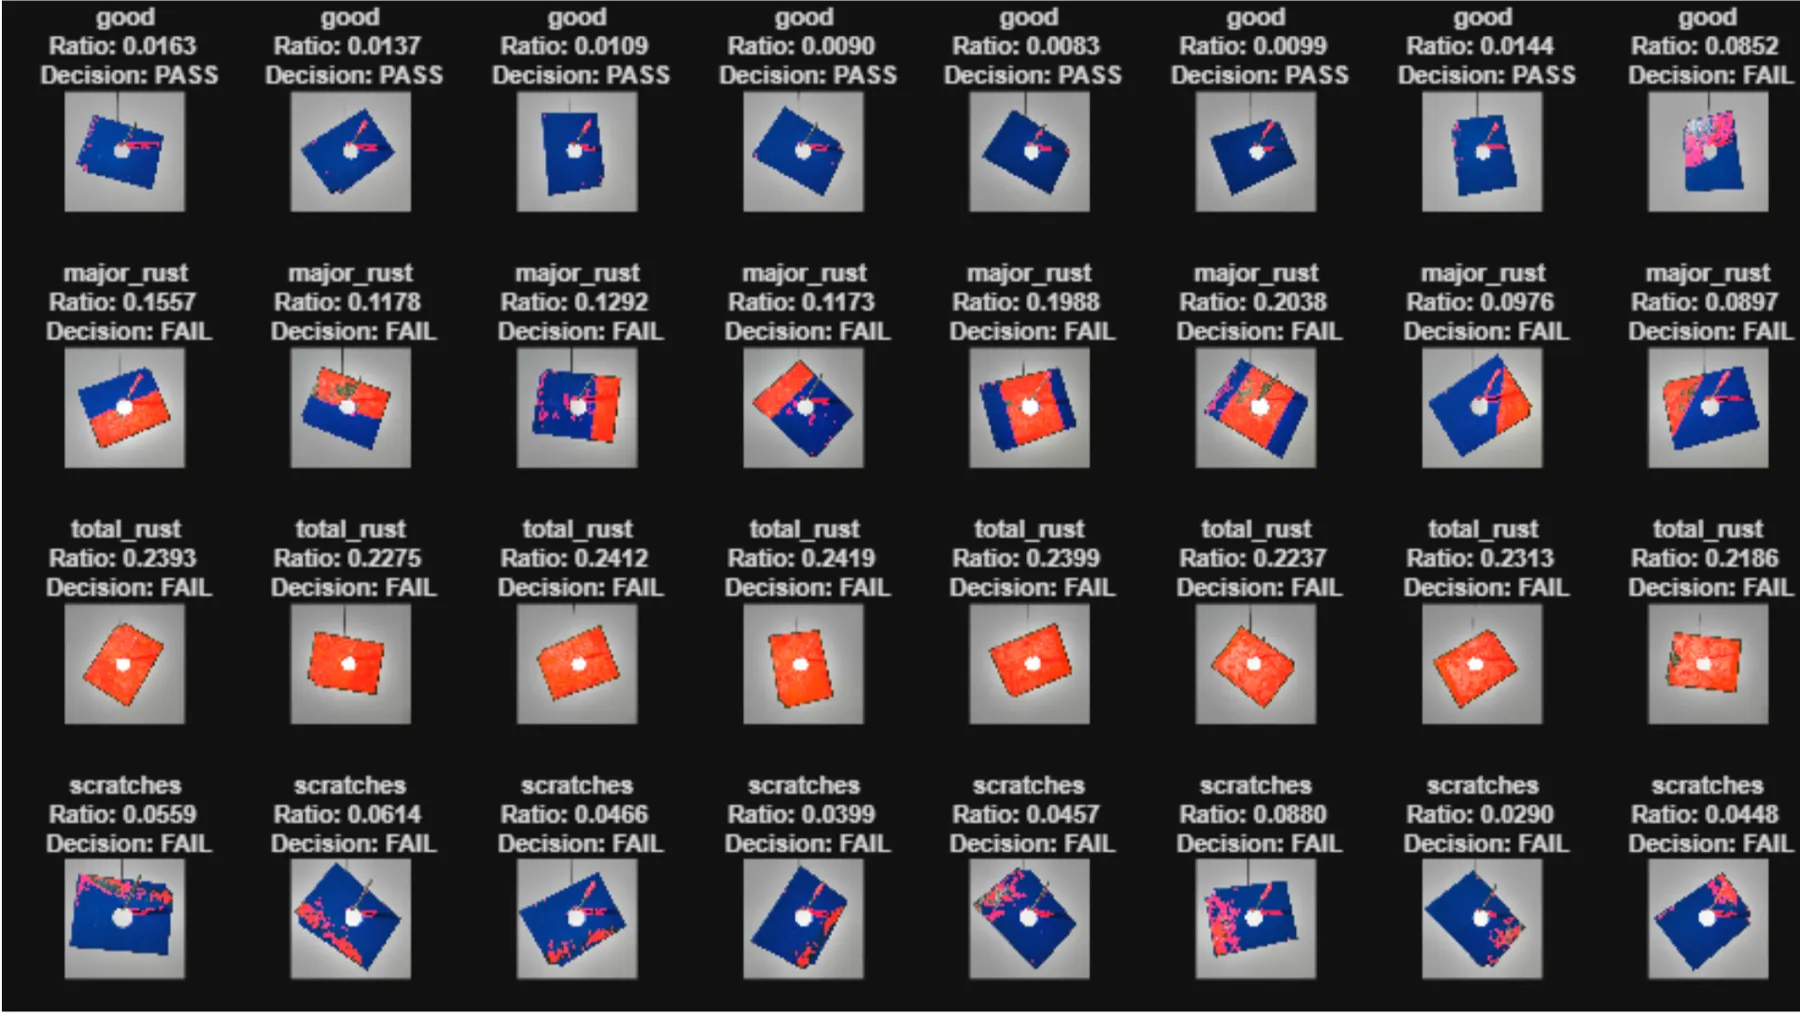
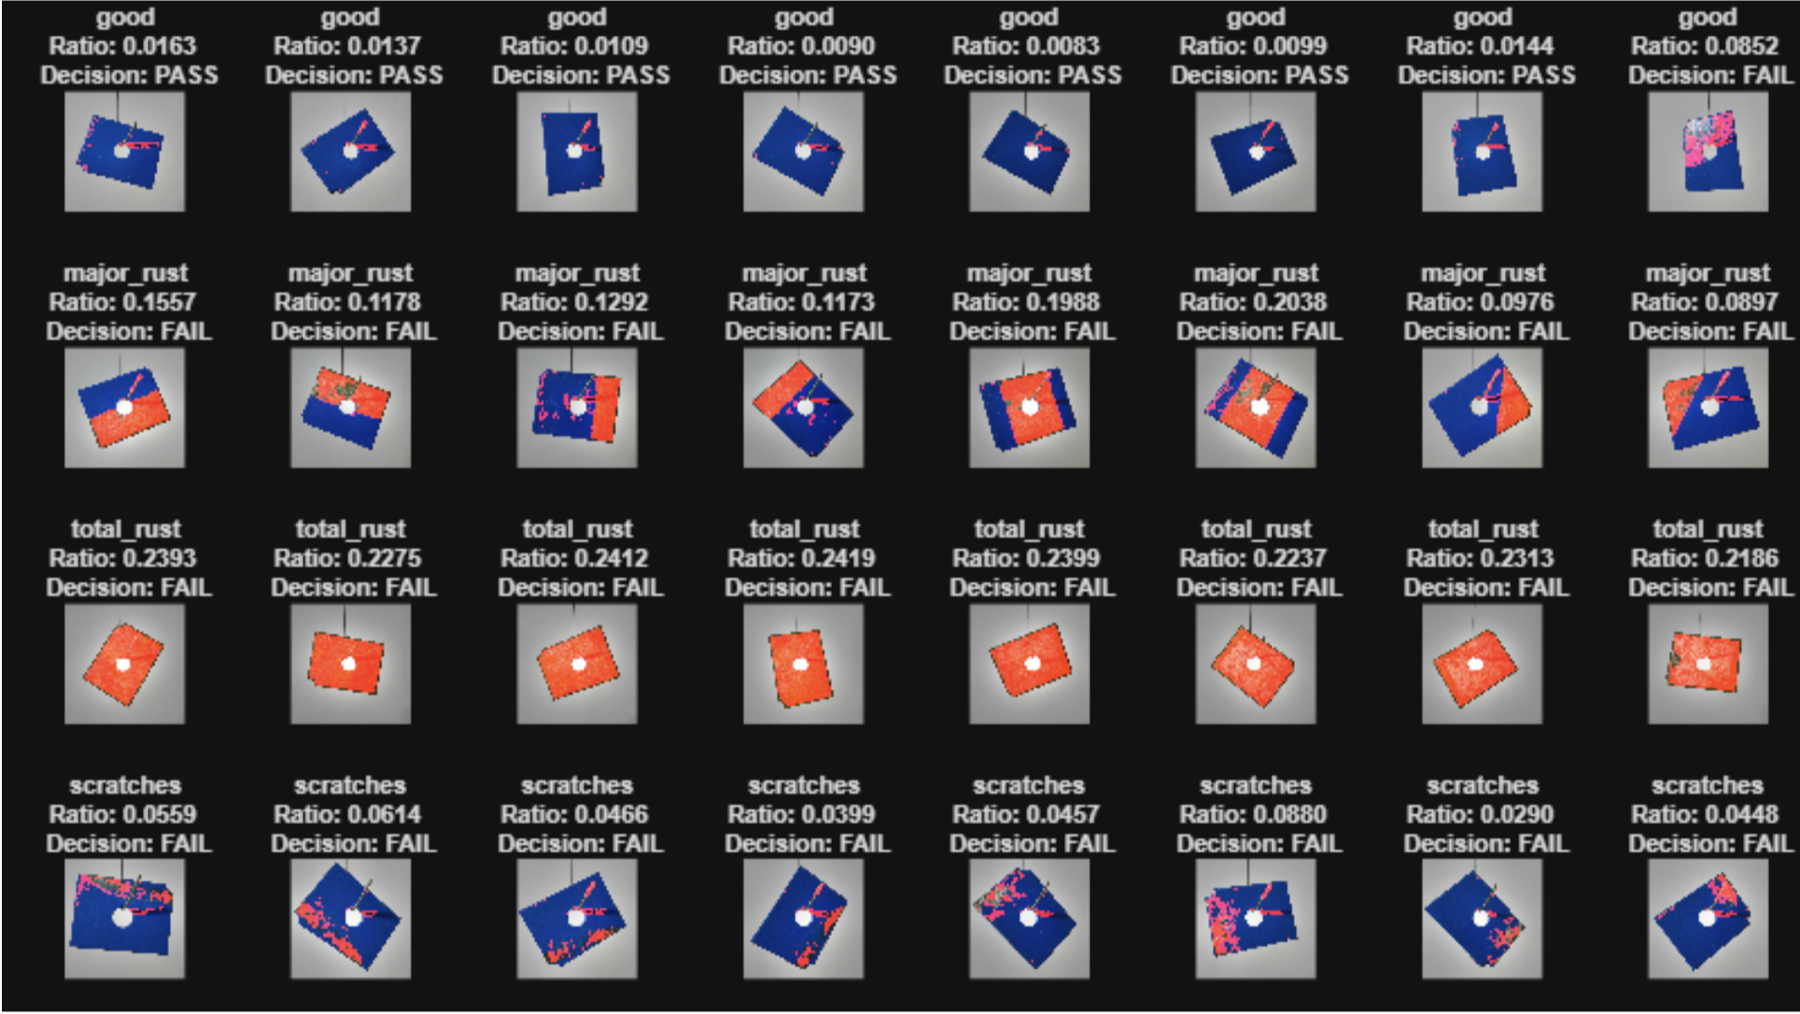
Flagged pixels are painted red on the photo, so every decision comes with visible evidence. extractMetrics then measures the area ratio, the share of the image that was flagged, and decideRules turns it into a first pass/fail call.
The baseline made the right call on 31 of 32 sample plates. Its one miss was a good plate with harsh glare, which the edge detector read as scratches. More damage means a higher ratio, which makes the area ratio a strong, consistent signal of a plate’s condition.
 (opens full size in a new tab)
View as table
| Category | Area ratio range | Baseline calls |
|---|---|---|
| good | 0.0083–0.0163, plus one glare outlier at 0.0852 | 7 PASS, 1 FAIL |
| scratches | 0.0290–0.0880 | 8 FAIL |
| major rust | 0.0897–0.2038 | 8 FAIL |
| total rust | 0.2186–0.2419 | 8 FAIL |
Training
Teach a pretrained network to recognize the four plate categories.
04Train the AI classifier
The dataset holds only 151 images, so training a network from scratch would overfit. Instead we used transfer learning: ResNet-18, pretrained to recognize 1,000 kinds of everyday objects, with its last two layers replaced by a new four-category head.
- Split: 70% training, 15% validation, 15% testing.
- Augmentation: random rotations up to 15°, horizontal and vertical flips, and shifts of up to 10 pixels add variety and simulate parts moving on a factory line.
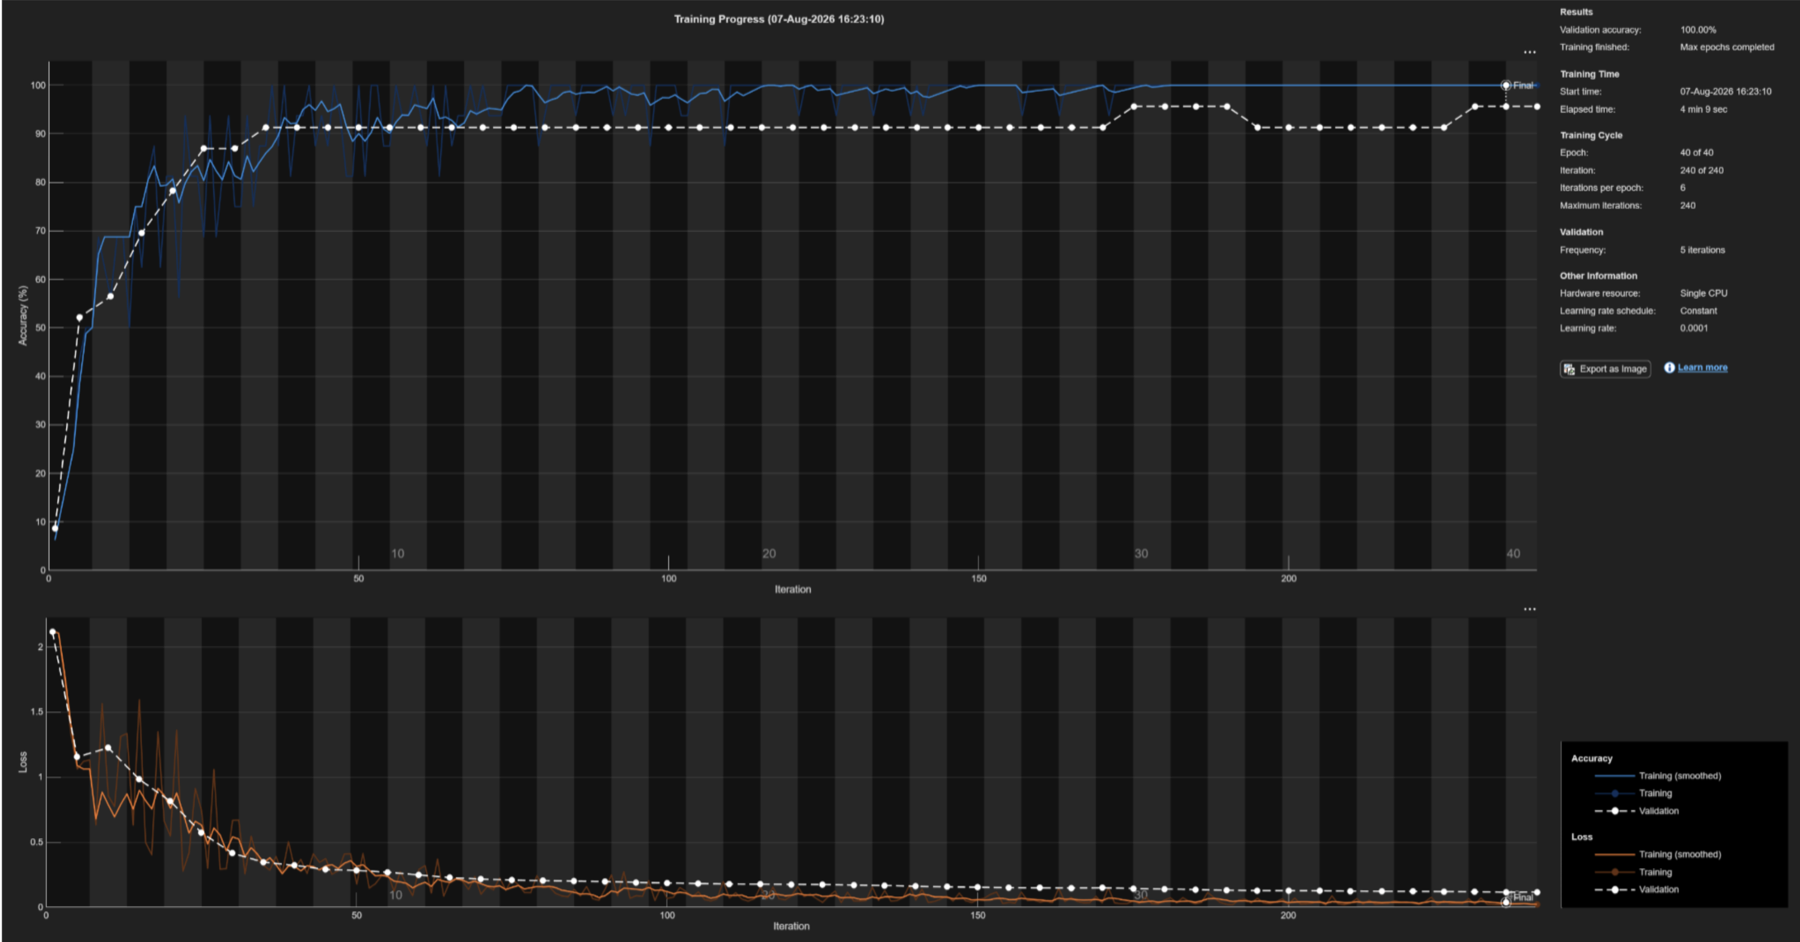
- Training: SGDM with a learning rate of 1e-4, mini-batches of 16, and up to 40 epochs, with validation every 5 iterations to stop before overfitting.
Early runs reached only about 80% accuracy, and the model kept confusing scratches with good plates and major rust with total rust. More augmentation and 40 epochs instead of 5 lifted it to 95–100%, depending on the run. We trained the same configuration 10 times and kept the best network.
 (opens full size in a new tab)
Results
Run held-out plates through the full hybrid system, then make the photos harder.
05Test the full inspection
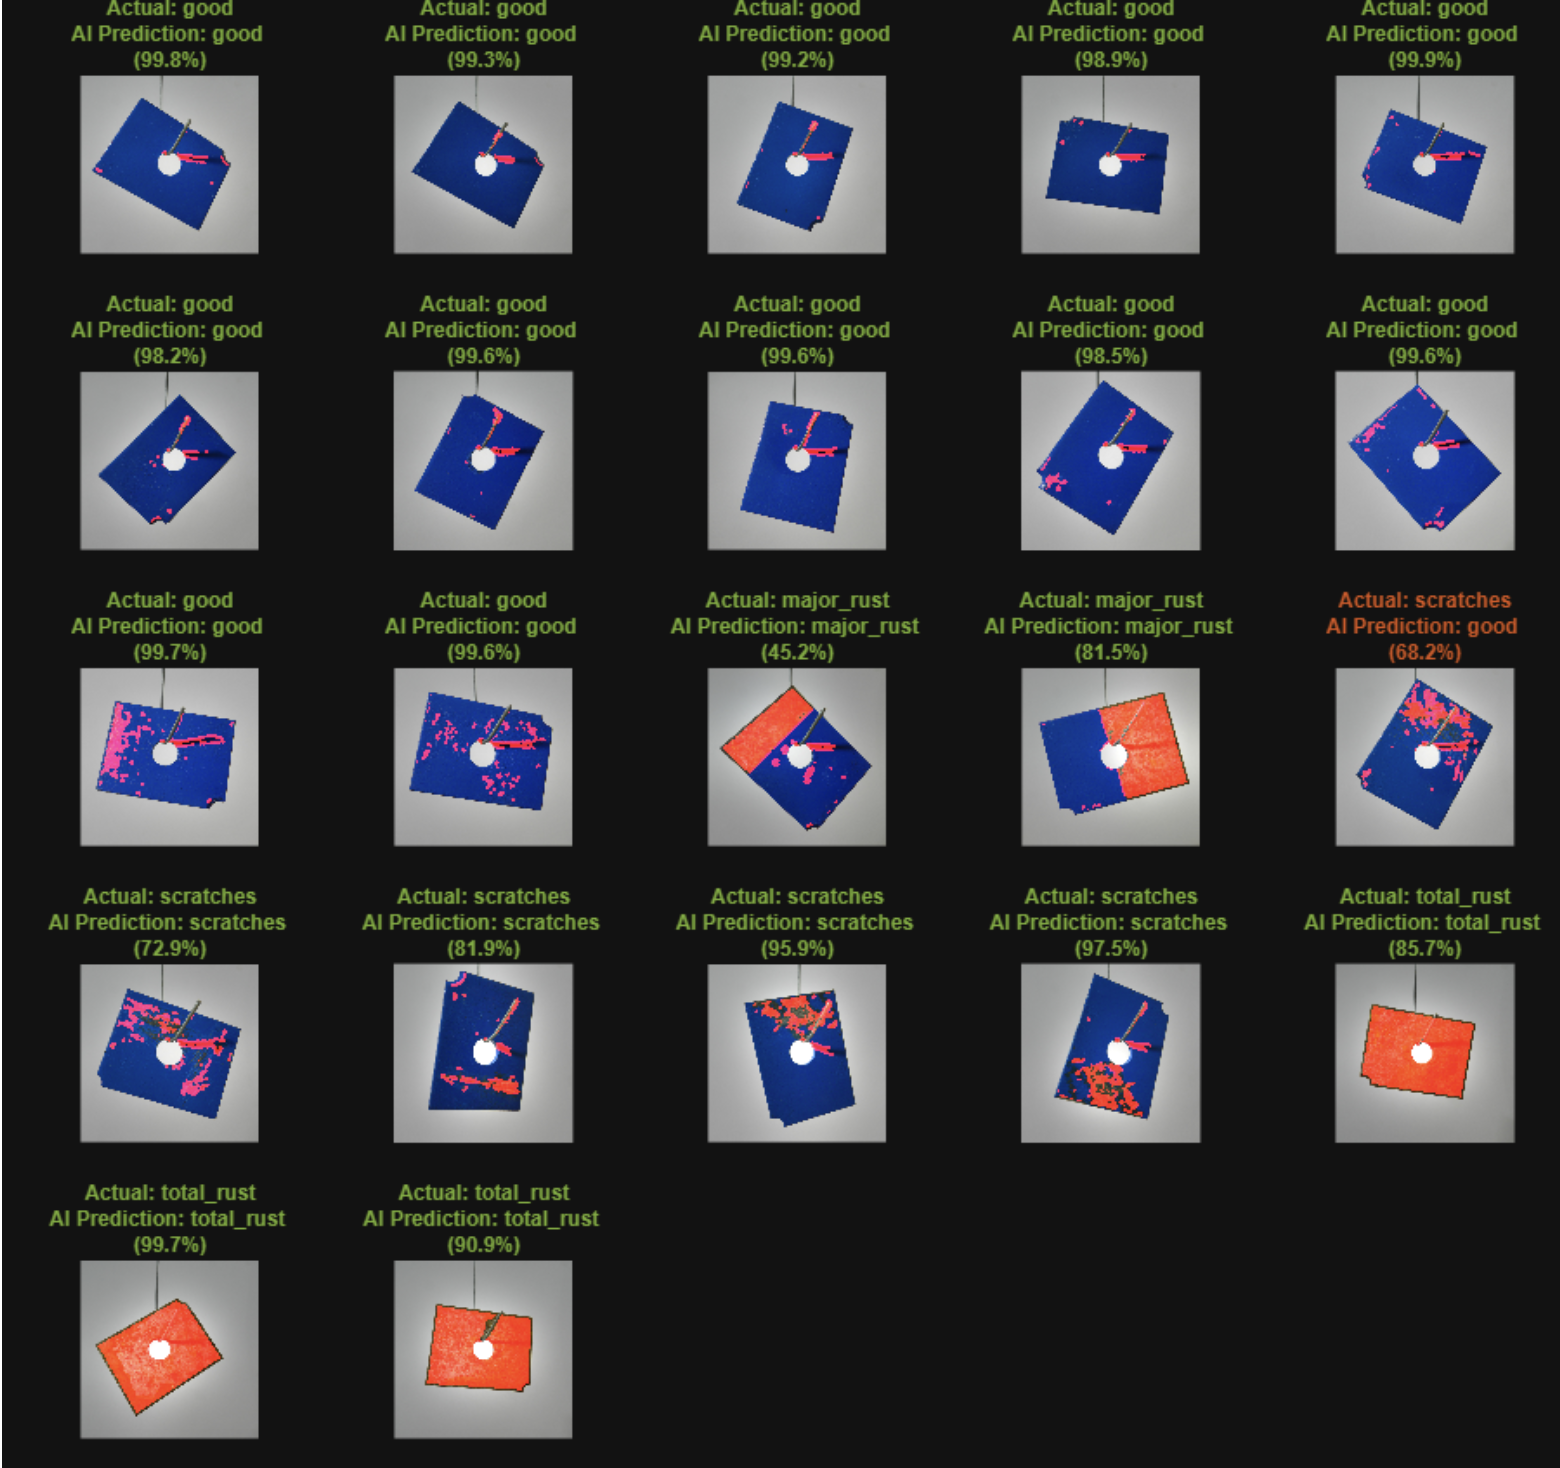
inspectPart runs a plate through both paths. It returns the AI’s category and confidence, the red evidence overlay, the area metrics, and the baseline’s pass/fail call.
On 22 held-out test plates, the AI classified 21 of 22 correctly, for 95.5% accuracy, and it never failed a good plate: a 0% false-reject rate. The one miss was a scratched plate labeled good at 68.2% confidence. The baseline and the AI disagreed on 3 plates, and the AI was right on 2 of them.
The test split was randomized and the saved model came from an earlier run, so some test images may overlap with training data. These numbers are likely slightly optimistic.
| Predicted | |||||
|---|---|---|---|---|---|
| Actual | good | major rust | scratches | total rust | Correct |
| good | 12 | 0 | 0 | 0 | 100% |
| major rust | 0 | 2 | 0 | 0 | 100% |
| scratches | 1 | 0 | 4 | 0 | 80% |
| total rust | 0 | 0 | 0 | 3 | 100% |
 (opens full size in a new tab)
06Stress test with distortions
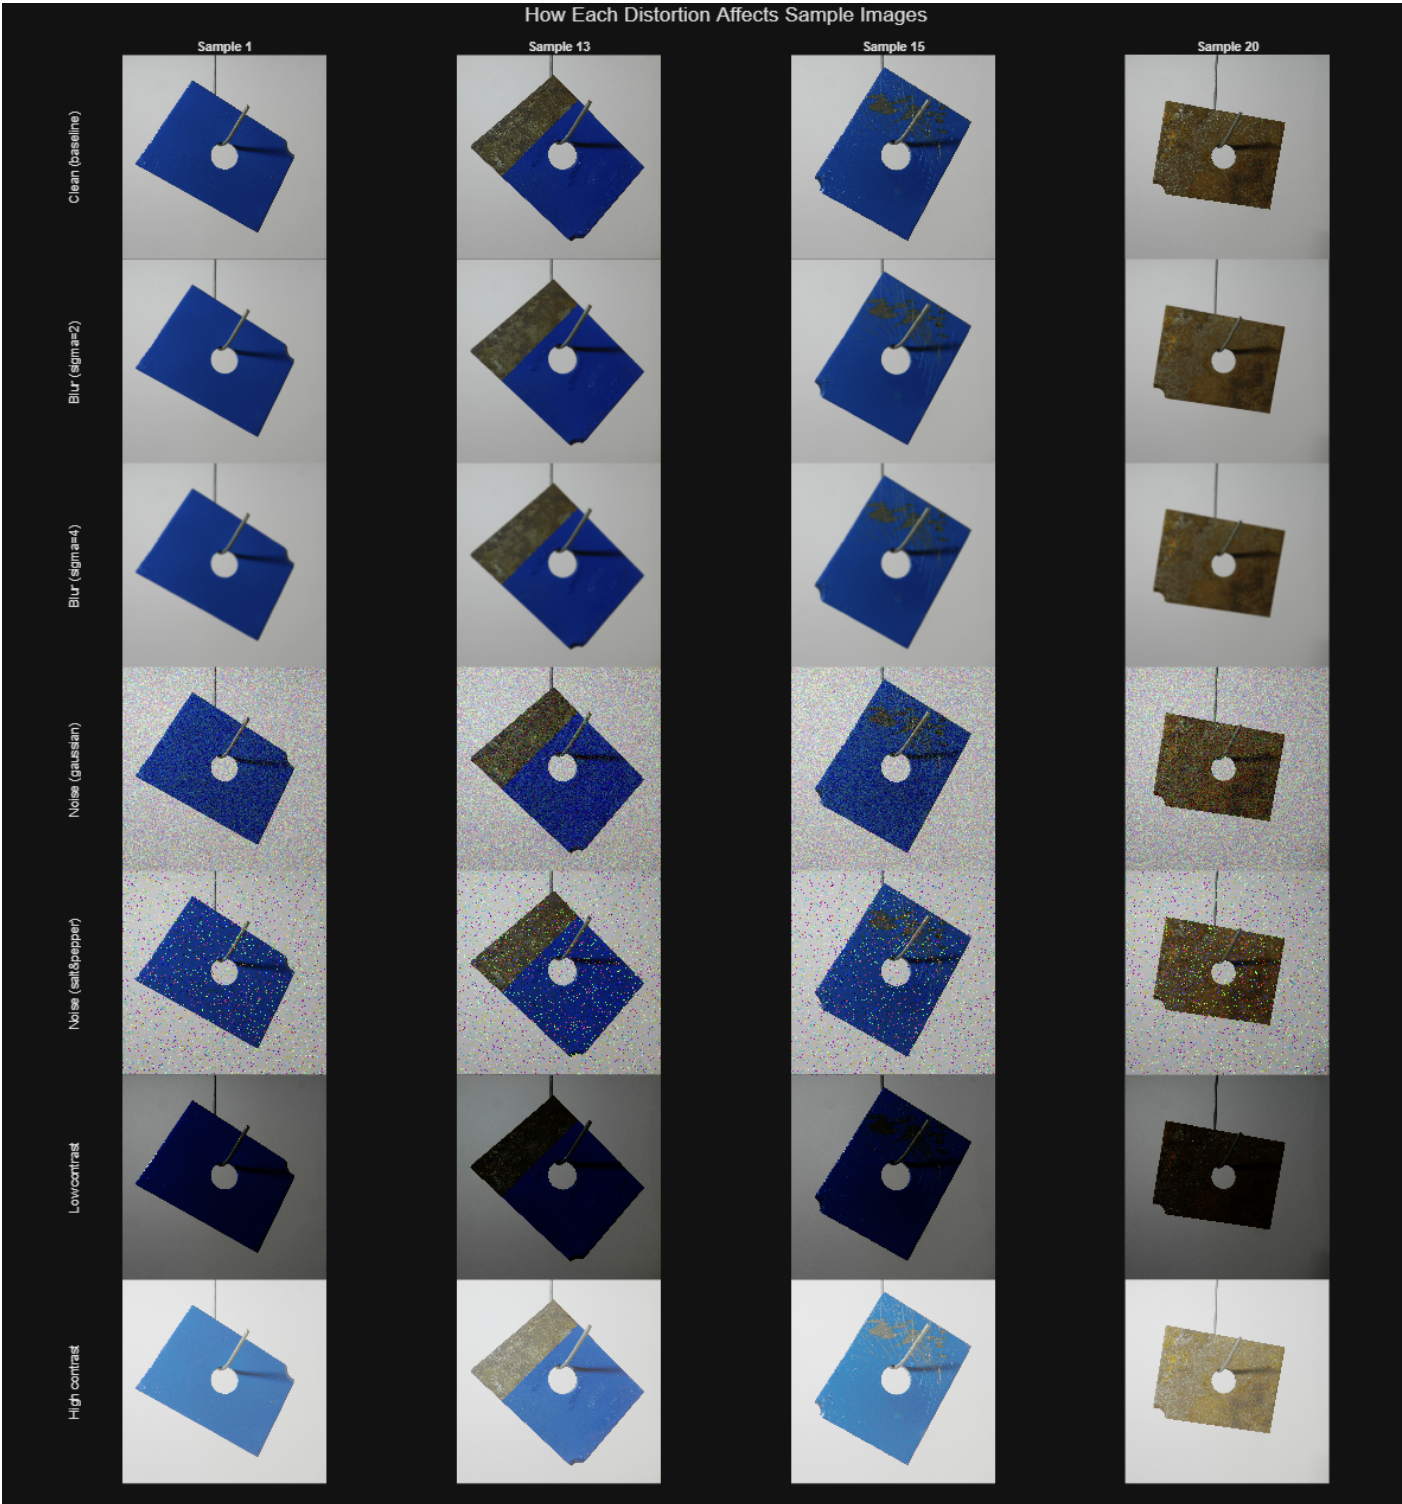
Factory cameras aren’t perfect, so the same 22 test plates were rerun under six distortions: Gaussian blur at σ = 2 and σ = 4, Gaussian and salt-and-pepper noise, and low and high contrast.
- Noise didn’t hurt. Accuracy held at 100% under both noise conditions.
- Low contrast did the most damage. Simulating a dark scene dropped accuracy to 86.4% and let 3 of the 10 defective plates pass.
- No false alarms. No condition caused a good plate to fail.
View as table
| Condition | Accuracy | Good plates failed | Defective plates passed |
|---|---|---|---|
| Clean (baseline) | 95.5% | 0 of 12 | 1 of 10 |
| Blur, σ = 2 | 95.5% | 0 of 12 | 1 of 10 |
| Blur, σ = 4 | 90.9% | 0 of 12 | 2 of 10 |
| Gaussian noise | 100% | 0 of 12 | 0 of 10 |
| Salt-and-pepper noise | 100% | 0 of 12 | 0 of 10 |
| Low contrast | 86.4% | 0 of 12 | 3 of 10 |
| High contrast | 90.9% | 0 of 12 | 2 of 10 |
 (opens full size in a new tab)
Limitations and next steps
- Small dataset. The metal plate set has only 151 images. Augmentation helped, but a network trained on so little data always risks overfitting.
- Clean backgrounds. Every photo has a uniform backdrop, which made classification easier than it would be on a real production line.
- Next: capture plates in real factory conditions to grow the dataset, add defect types like dents and cracks, and deploy the pipeline to an industrial camera to test real-time speed.
Dataset: MPDD (Jezek et al., 2021).